New Marquette Law School Poll national survey finds public strongly favors some Trump policies, strongly opposes others
Recognizing only two sexes and immigrant orders are most popular, “Gulf of America” naming and Jan. 6 pardons least popular
Feb. 12, 2025
Other highlights:
- Overall opinion is skeptical on tariffs
- Majorities doubt Trump will reduce inflation
- Polarized views by party remain very strong
- Opinion shifts toward increased optimism on the nation’s direction
Please note: Complete Poll results and methodology information can be found online at law.marquette.edu/poll
MILWAUKEE – A new Marquette Law School Poll national survey finds substantial majorities support some of President Donald Trump’s early initiatives, while equally substantial majorities oppose others of his policies.
Here are Trump’s executive orders, among those covered in the poll, garnering favorable support:
- The federal government’s recognizing only two sexes, male and female, is supported by 63% and opposed by 37%.
- Asked about deporting immigrants in the United States illegally, 60% are in favor and 40% are opposed.
- Similarly, 60% favor expanding oil and gas production.
- And 59% favor declaring a national emergency due to migrant crossings at the southern border.
Conversely, here are executive orders with majority unfavorability:
- A majority, 57%, oppose deporting immigrants who have been in the in the United States illegally for a number of years, have jobs, and no criminal record, while 43% favor deportation in this circumstance.
- A larger majority, 65%, oppose Trump’s announcement in his inaugural address that the United States will take back the Panama Canal, while 35% favor this.
- The pardon of all January 6 defendants is opposed by 65% and favored by 34%.
- Renaming the Gulf of Mexico as the Gulf of America is opposed by 71% and favored by 29%.
These results are shown in Figure 1 and Table 1.
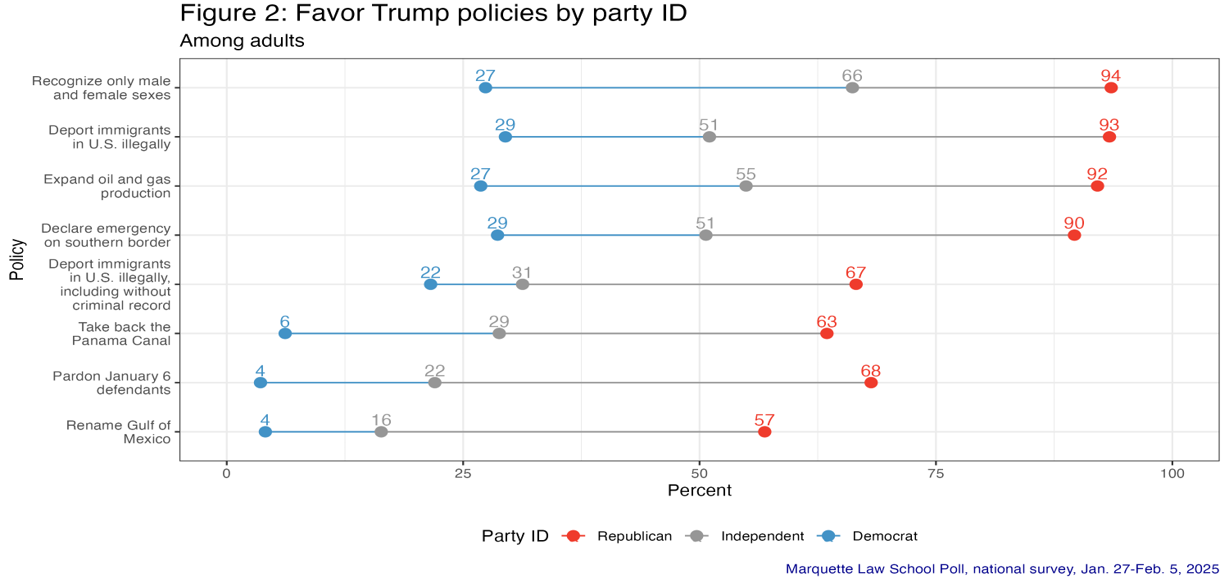
Table 1: Favor or oppose Trump policies
Among adults
|
|
Favor or oppose
|
|
Policy
|
Favor
|
Oppose
|
|
Recognize only male and female sexes
|
63
|
37
|
|
Deport immigrants in U.S. illegally
|
60
|
40
|
|
Expand oil and gas production
|
60
|
40
|
|
Declare emergency on southern border
|
59
|
41
|
|
Deport immigrants in U.S. illegally, including without criminal record
|
43
|
57
|
|
Take back the Panama Canal
|
35
|
65
|
|
Pardon January 6 defendants
|
34
|
65
|
|
Rename Gulf of Mexico
|
29
|
71
|
|
Marquette Law School Poll, national survey, Jan. 27-Feb. 5, 2025
|
|
Question: See full text of questions at end of this release
|
Partisan differences are large, with a majority of Republicans supporting all the Trump policies, a majority of Democrats opposed to each policy, and majorities of independents supporting some policies while opposing others.
The survey was conducted Jan. 27-Feb. 5, 2025, interviewing 1,018 adults nationwide, with a margin of error of +/-3.5 percentage points.
More than 90% of Republicans favor Trump’s most popular actions: those on recognizing two sexes, deporting immigrants in the United States illegally, expanding oil and gas production, and declaring an emergency on the border. A substantial majority of independents, 66%, favor recognizing two sexes, while slight majorities of independents favor deporting immigrants (51%), expanding oil and gas production (55%), and declaring a border emergency (51%). Among Democrats, substantial majorities oppose each of these policies, although more than a quarter of Democrats variously support these initiatives by Trump.
Of the four policies that face majority opposition among all adults, between 57% and 68% of Republicans support Trump’s positions. Among Republicans, 67% favor deportations of immigrants including those with no criminal record, 63% support taking back the Panama Canal, 68% favor pardons for Jan. 6 defendants, and 57% favor renaming the Gulf of Mexico.
Among independents, majorities oppose all four of these policies, with 69% opposed to deporting immigrants in the United States illegally who have jobs and no criminal record, 71% opposed to taking back the Panama Canal, 76% opposed to pardons for Jan. 6 defendants, and 82% opposed to renaming the Gulf of Mexico.
Among Democrats, 78% oppose deporting immigrants with no criminal record, though nearly a quarter, 22%, support this. For the other three unpopular proposals, more than 90% of Democrats are opposed, with 94% opposed to taking back the Panama Canal, 96% opposed to pardons for Jan. 6 defendants, and 96% opposed to renaming the Gulf of Mexico.
These results are shown in Figure 2 and Table 2.
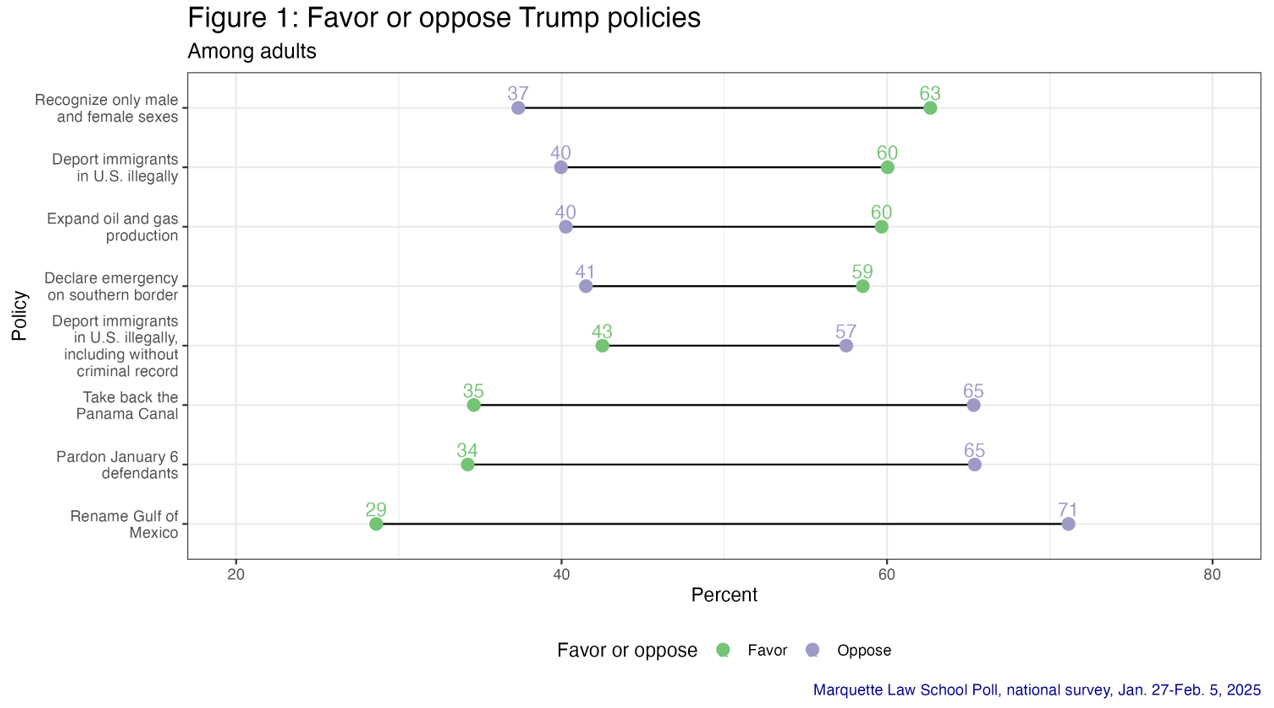
Table 2: Favor Trump policies, by party ID
Among adults
|
Policy
|
Total favor
|
Republican
|
Independent
|
Democrat
|
|
Recognize only male and female sexes
|
63
|
94
|
66
|
27
|
|
Deport immigrants in U.S. illegally
|
60
|
93
|
51
|
29
|
|
Expand oil and gas production
|
60
|
92
|
55
|
27
|
|
Declare emergency on southern border
|
59
|
90
|
51
|
29
|
|
Deport immigrants in U.S. illegally, including without criminal record
|
43
|
67
|
31
|
22
|
|
Take back the Panama Canal
|
35
|
63
|
29
|
6
|
|
Pardon January 6 defendants
|
34
|
68
|
22
|
4
|
|
Rename Gulf of Mexico
|
29
|
57
|
16
|
4
|
|
Marquette Law School Poll, national survey, Jan. 27-Feb. 5, 2025
|
|
Question: See full text of questions at end of this release
|
The public is somewhat skeptical of tariffs, with 24% who say tariffs will help the U.S. economy and 46% who say tariffs will hurt the economy. There is substantial uncertainty on this question, with 13% saying tariffs won’t have much effect and another 17% who say they don’t know.
Almost half of Republicans (49%) think tariffs will help, while 16% think they will hurt. The rest see no effect or say they don’t know. Independents are much more skeptical of tariffs, with 12% saying they help the economy, 45% saying they hurt the economy, and a large 44% who say they make no difference or who don’t know. A large majority of Democrats (80%) think tariffs hurt the economy, and only 4% who think they help the economy. Uncertainty about tariffs is smaller among Democrats than among independents or Republicans, with 16% saying tariffs have no effect or they don’t know. These results are shown in Table 3.
Table 3: Effect of tariffs on the economy, by party identification
Among adults
|
Party ID
|
Effect of tariffs
|
|
Helps U.S. economy
|
Hurts U.S. economy
|
Doesn't make much difference
|
Don't know
|
|
Among all adults
|
24
|
46
|
13
|
17
|
|
Republican
|
49
|
16
|
16
|
18
|
|
Independent
|
12
|
45
|
17
|
27
|
|
Democrat
|
4
|
80
|
7
|
9
|
|
Marquette Law School Poll, national survey, Jan. 27-Feb. 5, 2025
|
|
Question: In general, do you think imposing tariffs or fees on products imported from other countries helps the U.S. economy, hurts the economy, or doesn’t make much of a difference either way?
|
Among all adults, nearly half (49%) think Trump’s policy proposals will increase inflation, while 36% think his policies will decrease inflation and 15% say they won’t affect inflation. Seventy percent of Republicans are confident Trump’s policies will decrease inflation, a view shared by only 26% of independents and 5% of Democrats. These results are shown in Table 4.
Table 4: Effect of Trump policies on inflation, by party identification
Among adults
|
Party ID
|
Effect on inflation
|
|
Decrease inflation
|
Increase inflation
|
Have no effect on inflation
|
|
Among all adults
|
36
|
49
|
15
|
|
Republican
|
70
|
16
|
13
|
|
Independent
|
26
|
47
|
26
|
|
Democrat
|
5
|
85
|
10
|
|
Marquette Law School Poll, national survey, Jan. 27-Feb. 5, 2025
|
|
Question: Do you think Trump’s policy proposals will decrease inflation, increase inflation, or have no effect on inflation?
|
A sizable majority of adults (60%) support the law passed in 2024 that requires the Chinese-owned social media app TikTok to be sold or banned, with 40% opposing the sale or ban. Trump has halted enforcement of the law for a period of time while a resolution of the issue is sought.
Among Republicans, a large majority (72%) support the law requiring sale of TikTok, while 54% of independents and 49% of Democrats support the required sale. These results are shown in Table 5.
Table 5: TikTok sale or ban, by party identification
Among adults
|
Party ID
|
TikTok position
|
|
Require sale
|
Continue to be available
|
|
Among all adults
|
60
|
40
|
|
Republican
|
72
|
28
|
|
Independent
|
54
|
46
|
|
Democrat
|
49
|
51
|
|
Marquette Law School Poll, national survey, Jan. 27-Feb. 5, 2025
|
|
Question: About 170 million Americans use the TikTok app but Congress passed a law requiring it to be sold or banned because it is owned by a Chinese company that could potentially provide the Chinese government with sensitive information about Americans. Do you think these national security concerns are important enough to require the sale or banning of TikTok or do you think Americans should continue to be able to use the app?
|
Those who are frequent users of TikTok, saying they use it several times a day or several times a week, are most opposed to the sale or ban of the app, with 80% opposed to the sale or banning and 20% favoring the requirement. Among those who only use the app occasionally or who have used it but have stopped, 58% support the law while 42% say Tik Tok should remain available. Those who have never used TikTok are most in favor of the law, 77%, with 23% saying it should remain available. These results are shown in Table 6.
Table 6: TikTok sale or ban, by use of the app
Among adults
|
TikTok use
|
TikTok position
|
|
Require sale
|
Continue to be available
|
|
Among all adults
|
60
|
40
|
|
Frequent user
|
20
|
80
|
|
Occasional or past user
|
58
|
42
|
|
Never used
|
77
|
23
|
|
Marquette Law School Poll, national survey, Jan. 27-Feb. 5, 2025
|
|
Question: About 170 million Americans use the TikTok app but Congress passed a law requiring it to be sold or banned because it is owned by a Chinese company that could potentially provide the Chinese government with sensitive information about Americans. Do you think these national security concerns are important enough to require the sale or banning of TikTok or do you think Americans should continue to be able to use the app?
|
|
Question: How often, if ever, do you use the TikTok app?
|
Younger people are more likely to be frequent users of TikTok. Among those 18-29 years old, 38% report frequent use of TikTok. That rate falls to 29% among those 30-44 and to 19% among 45-59-year-olds. Of those 60 or over, just 9% report frequent use of TikTok.
In line with the relationship between age and use of TikTok, younger people are also more likely to say TikTok should remain available, while older people are more likely to support the law requiring sale or banning of the app. These results are shown in Table 7.
Table 7: TikTok sale or ban, by age
Among adults
|
Age
|
TikTok position
|
|
Require sale
|
Continue to be available
|
|
Among all adults
|
60
|
40
|
|
18-29
|
44
|
56
|
|
30-44
|
49
|
51
|
|
45-59
|
61
|
39
|
|
60+
|
78
|
22
|
|
Marquette Law School Poll, national survey, Jan. 27-Feb. 5, 2025
|
|
Question: About 170 million Americans use the TikTok app but Congress passed a law requiring it to be sold or banned because it is owned by a Chinese company that could potentially provide the Chinese government with sensitive information about Americans. Do you think these national security concerns are important enough to require the sale or banning of TikTok or do you think Americans should continue to be able to use the app?
|
Attention to news
In the weeks following Trump’s inauguration, 70% of people nationwide say they have heard or read a lot about plans to deport immigrants in the United States illegally. Fewer (53%) say they have heard or read a lot about plans to reduce the size of government, and 49% say they have read or heard a lot about Trump’s cabinet nominees. Thirty-nine percent say they heard or read a lot about Trump’s inaugural address. These results are shown in Table 8.
Table 8: Attention to news topics
Among adults
|
Topic
|
Heard or read
|
|
A lot
|
A little
|
Nothing at all
|
|
Deportation of immigrants in U.S. illegally
|
70
|
26
|
4
|
|
Plans to reduce the size of government
|
53
|
35
|
12
|
|
Choices for cabinet positions
|
49
|
40
|
11
|
|
President Trump's inaugural address
|
39
|
45
|
16
|
|
Marquette Law School Poll, national survey, Jan. 27-Feb. 5, 2025
|
|
Question: Here are some recent topics in the news. How much have you heard or read about each of these?
|
Likes and dislikes about Donald Trump
The survey asked people to say in their own words what they like or dislike about Donald Trump. The full set of responses is posted online.
Political divisions are apparent in the open-ended responses. Many people give only a positive view of Trump, and others give only a negative view of him. A pair of responses illustrate this category:
Likes: “Everything.” Dislikes: “Nothing.”
While, for another respondent:
Likes: “Nothing.” Dislikes: “He is disgusting.”
Of all respondents, 14% had only a positive comment about Trump and 36% had only a negative comment.
Those with mixed feelings, about 47% of respondents, provide greater insight into Trump’s strengths and weaknesses.
- One respondent, an 80-year-old white male, said, “Promises made, promises kept. Tired of politicians who lie to your face to get elected and then just feather there (sic) own nest.” But the same person said, “Tone down the rhetoric and don’t be so crude.”
- Comments about Trump’s verbal style are common, even among those who have positive things to say about him. In another example, a 24-year-old white male said he liked “the fact that he declared that there’s only 2 genders.” He added, “I like his policy on immigration. I also like his implementation of tariffs to encourage more things being produced in America.” But he also said, “He doesn’t think before he speaks some of the times.”
- A 45-year-old male who did not report his race said, “He does what he campaigned he would do and he doesn’t care what his opponents think.” But he also said, “He treats people as disposable objects at times and how he communicates can be harsh when it does not need to be.”
- Strong leadership was a common theme in the comments, but sometimes it was paired with substantive disagreement. A 65-year-old white male said he likes Trump’s “strong leadership.” He added, “I like that he is trying to make the US stronger.” The man also noted, “He is only concerned about Trump. Top/bottom leader with a huge ego. Very disappointed that he paroled the Jan. 6 people.”
- On immigration, some see both positive and negative aspects of the issue. A 47-year-old Black female respondent said she likes “how he is trying to fix the immigration,” but “the way he going about it is wrong by snatching them all, even if they are working and have no record with the police.”
- Elon Musk’s position in the administration was noted by a 50-year-old multiracial male who said, “I like that he’s fulfilling campaign promises, that his cabinet picks are not payback positions . . . I like that he ended the Madness of multiple Genders . . . I dislike the decision to allow unelected Elon Musk so much involvement in government.”
- A 63-year-old white female mentioned she dislikes “when he allows private citizen Elon Musk into secure systems, thereby endangering American citizens. There are no more guardrails.”
- A 58-year-old white male respondent is positive about Trump. He said, “He has common sense. He’s always the smartest guy in the room. He is results oriented. He doesn’t need to be liked or told what to do. He’s NOT Joe Biden. He treats the media with the disdain they deserve. He speaks for the common man.”
- One respondent gave a mixed opinion on Trump: “His hiring choices in the first term were dreadful because of the advice he had been given,” he said. “Sometimes he needs to be more succinct, but he is by far the most effective political communicator in my lifetime.”
Approval and favorability
Trump starts his second term with 48% saying they approve of the job he is doing as president and 52% saying they disapprove. When asked in the Marquette Law School Poll in September 2020, near the end of Trump’s first term, 41% approved and 58% disapproved. In the new poll, as in the past, approval is closely related to partisanship, with 89% of Republicans approving of Trump, a view shared by 37% of independents and 9% of Democrats, as shown in Table 9.
Table 9: Trump approval, by party identification
Among adults
|
Party ID
|
Approval
|
|
Approve
|
Disapprove
|
|
Among all adults
|
48
|
52
|
|
Republican
|
89
|
11
|
|
Independent
|
37
|
63
|
|
Democrat
|
9
|
91
|
|
Marquette Law School Poll, national survey, Jan. 27-Feb. 5, 2025
|
|
Question: Overall, how much do you approve or disapprove of the way Donald Trump is handling his job as president?
|
Approval of how Trump has handled his cabinet selections is virtually identical to his overall approval, with 47% approving and 52% disapproving.
Opinion of four cabinet nominees shows a range of favorability and relatively low familiarity with the choices.
- Secretary of State Marco Rubio is seen favorably by 43% and unfavorably by 31%, with 26% who haven’t heard enough to have an opinion.
- Health and Human Services nominee Robert F. Kennedy Jr. is viewed favorably by 39% and unfavorably by 46%, while 14% haven’t heard enough about him.
- Defense Secretary Pete Hegseth has a 28% favorable rating and a 37% unfavorable rating, while 35% say they haven’t heard enough.
- The least well-known nominee in this survey is Attorney General Pam Bondi, with 29% favorable, 28% unfavorable, and 43% who don’t know enough about her.
These numbers have changed little since December, shortly after these nominations were announced. Rubio’s net favorability increased slightly since December, while Kennedy’s declined. Hegseth and Bondi were virtually unchanged. These results are shown in Table 10.
Table 10: Favorability of cabinet nominees
Among adults
|
Favorability
|
|
Poll dates
|
Net favorable
|
Favorable
|
Unfavorable
|
Haven't heard enough
|
|
Marco Rubio
|
|
1/27-2/6/25
|
12
|
43
|
31
|
26
|
|
12/2-11/24
|
3
|
39
|
36
|
25
|
|
Robert F. Kennedy, Jr.
|
|
1/27-2/6/25
|
-7
|
39
|
46
|
14
|
|
12/2-11/24
|
0
|
44
|
44
|
11
|
|
Pete Hegseth
|
|
1/27-2/6/25
|
-9
|
28
|
37
|
35
|
|
12/2-11/24
|
-10
|
27
|
37
|
37
|
|
Pam Bondi
|
|
1/27-2/6/25
|
1
|
29
|
28
|
43
|
|
12/2-11/24
|
-3
|
28
|
31
|
41
|
|
Marquette Law School Poll, national survey, Jan. 27-Feb. 5, 2025
|
|
Question: Do you have a favorable or an unfavorable opinion of the following people or haven’t you heard enough yet to have an opinion?
|
Trump’s overall favorable rating stands at 44%, with 54% unfavorable. This is a small decline since December when he was seen favorably by 49% and unfavorably by 50%. Trump’s favorability has recovered from his low point of 32% favorable and 67% unfavorable in January 2022. The full trend for Trump’s favorability is shown in Table 11.
Table 11: Trump favorability trend
Among adults
|
Poll dates
|
Favorability
|
|
Net
|
Favorable
|
Unfavorable
|
Haven't heard enough
|
|
1/27-2/6/25
|
-10
|
44
|
54
|
2
|
|
12/2-11/24
|
-1
|
49
|
50
|
1
|
|
10/1-10/24
|
-11
|
44
|
55
|
1
|
|
7/24-8/1/24
|
-6
|
46
|
52
|
2
|
|
5/6-15/24
|
-16
|
41
|
57
|
2
|
|
3/18-28/24
|
-10
|
44
|
54
|
2
|
|
2/5-15/24
|
-10
|
44
|
54
|
2
|
|
11/2-7/23
|
-14
|
42
|
56
|
2
|
|
9/18-25/23
|
-14
|
42
|
56
|
2
|
|
7/7-12/23
|
-28
|
35
|
63
|
2
|
|
5/8-18/23
|
-23
|
37
|
60
|
3
|
|
3/13-22/23
|
-27
|
35
|
62
|
3
|
|
1/9-20/23
|
-29
|
34
|
63
|
3
|
|
11/15-22/22
|
-34
|
32
|
66
|
2
|
|
9/7-14/22
|
-30
|
34
|
64
|
2
|
|
7/5-12/22
|
-28
|
34
|
62
|
4
|
|
5/9-19/22
|
-26
|
35
|
61
|
3
|
|
3/14-24/22
|
-25
|
36
|
61
|
3
|
|
1/10-21/22
|
-35
|
32
|
67
|
1
|
|
11/1-10/21
|
-33
|
32
|
65
|
3
|
|
Marquette Law School Poll, national surveys, latest: Jan. 27-Feb. 5, 2025
|
|
Question: Do you have a favorable or an unfavorable opinion of the following people or haven’t you heard enough yet to have an opinion?
|
Vice President JD Vance is seen favorably by 39% and unfavorably by 44%, with 17% saying they haven’t heard enough yet to say. Since being nominated for vice president, Vance has become better known, though, as with all vice presidents, he is less well known than the president. His net favorability has also improved. The trend in Vance’s favorability rating is shown in Table 12.
Table 12: Vance favorability trend
Among adults
|
Poll dates
|
Favorability
|
|
Net
|
Favorable
|
Unfavorable
|
Haven't heard enough
|
|
1/27-2/6/25
|
-5
|
39
|
44
|
17
|
|
12/2-11/24
|
-12
|
35
|
47
|
18
|
|
10/1-10/24
|
-15
|
30
|
45
|
25
|
|
7/24-8/1/24
|
-16
|
27
|
43
|
30
|
|
Marquette Law School Poll, national surveys, latest: Jan. 27-Feb. 5, 2025
|
|
Question: Do you have a favorable or an unfavorable opinion of the following people or haven’t you heard enough yet to have an opinion?
|
Direction of the country
Opinion about the direction of the country remains negative, with 62% saying the country is off on the wrong track and 38% saying it is headed in the right direction. However, the percentage saying right direction has nearly doubled from October 2024, when 20% said the country was headed in the right direction and 80% said it was on the wrong track.
Table 13: Direction of the country
Among adults
|
Poll dates
|
Direction of country
|
|
Right direction
|
Wrong track
|
|
1/27-2/6/25
|
38
|
62
|
|
12/2-11/24
|
25
|
75
|
|
10/1-10/24
|
20
|
80
|
|
Marquette Law School Poll, national surveys, latest: Jan. 27-Feb. 5, 2025
|
|
Question: Do you feel things in this country are generally going in the right direction, or do you feel things have gotten off on the wrong track?
|
The changing views of the direction of the country are closely tied to partisanship and the change of administration. In the current poll, 76% of Republicans say the country is headed in the right direction, while 7% said the same in October. Among Democrats, views moved in the opposite direction, with 7% currently saying the country is heading in the right direction, compared to 33% in October. Independents have changed their views less, with 20% saying right direction now, compared to 14% in October.
Table 14: Direction of the country, by party identification
Among adults
|
Poll dates
|
Direction of country
|
|
Right direction
|
Wrong track
|
|
Republican
|
|
1/27-2/6/25
|
76
|
24
|
|
12/2-11/24
|
22
|
78
|
|
10/1-10/24
|
7
|
93
|
|
Independent
|
|
1/27-2/6/25
|
20
|
80
|
|
12/2-11/24
|
27
|
73
|
|
10/1-10/24
|
14
|
86
|
|
Democrat
|
|
1/27-2/6/25
|
7
|
93
|
|
12/2-11/24
|
29
|
71
|
|
10/1-10/24
|
33
|
67
|
|
Marquette Law School Poll, national surveys, latest: Jan. 27-Feb. 5, 2025
|
|
Question: Do you feel things in this country are generally going in the right direction, or do you feel things have gotten off on the wrong track?
|
Economic conditions
There has been a substantial decline since July in the percentage of the public who say the economy is poor, but little change in the percentage saying it is excellent or good. By contrast, those saying it is not so good have increased. In the current poll, 15% say the economy is poor, a substantial decline from July when 35% said that. Those saying excellent or good make up 27% now, compared to 30% in July. Those saying the economy is not so good rose from 35% in July to 58% in February.
Table 15: Views of the national economy
Among adults
|
Poll dates
|
National economy
|
|
Excellent
|
Good
|
Not so good
|
Poor
|
|
1/27-2/6/25
|
1
|
26
|
58
|
15
|
|
12/2-11/24
|
4
|
25
|
50
|
21
|
|
10/1-10/24
|
3
|
21
|
45
|
31
|
|
7/24-8/1/24
|
3
|
27
|
35
|
35
|
|
5/6-15/24
|
3
|
26
|
40
|
31
|
|
3/18-28/24
|
4
|
27
|
39
|
30
|
|
2/5-15/24
|
5
|
27
|
41
|
26
|
|
11/2-7/23
|
2
|
22
|
42
|
33
|
|
9/18-25/23
|
3
|
18
|
47
|
32
|
|
Marquette Law School Poll, national surveys, latest: Jan. 27-Feb. 5, 2025
|
|
Question: How would you describe the state of the nation's economy these days?
|
Economic conditions by party identification
Each partisan group is less negative about the economy now than in July, with the largest change coming among Republicans who have shifted from 49% seeing a poor economy in July to 10% now. Among independents, 48% said the economy was poor in July and 24% said it was poor in February. Democrats’ views have barely changed from 18% saying poor in July to 16% in February.
Table 16: Views of the national economy, by party identification
Among adults
|
Poll dates
|
National economy
|
|
Excellent/Good
|
Not so good
|
Poor
|
|
Republican
|
|
1/27-2/6/25
|
27
|
63
|
10
|
|
12/2-11/24
|
11
|
57
|
32
|
|
10/1-10/24
|
8
|
47
|
44
|
|
7/24-8/1/24
|
12
|
38
|
49
|
|
5/6-15/24
|
10
|
40
|
49
|
|
3/18-28/24
|
14
|
45
|
41
|
|
2/5-15/24
|
15
|
46
|
39
|
|
11/2-7/23
|
9
|
40
|
52
|
|
9/18-25/23
|
6
|
43
|
51
|
|
Independent
|
|
1/27-2/6/25
|
16
|
60
|
24
|
|
12/2-11/24
|
20
|
55
|
25
|
|
10/1-10/24
|
18
|
38
|
44
|
|
7/24-8/1/24
|
23
|
29
|
48
|
|
5/6-15/24
|
19
|
51
|
30
|
|
3/18-28/24
|
18
|
45
|
37
|
|
2/5-15/24
|
18
|
45
|
37
|
|
11/2-7/23
|
11
|
51
|
38
|
|
9/18-25/23
|
8
|
57
|
35
|
|
Democrat
|
|
1/27-2/6/25
|
33
|
51
|
16
|
|
12/2-11/24
|
51
|
41
|
8
|
|
10/1-10/24
|
41
|
44
|
15
|
|
7/24-8/1/24
|
49
|
32
|
18
|
|
5/6-15/24
|
49
|
37
|
14
|
|
3/18-28/24
|
53
|
32
|
15
|
|
2/5-15/24
|
55
|
35
|
9
|
|
11/2-7/23
|
44
|
42
|
14
|
|
9/18-25/23
|
38
|
48
|
14
|
|
Marquette Law School Poll, national surveys, latest: Jan. 27-Feb. 5, 2025
|
|
Question: How would you describe the state of the nation's economy these days?
|
About the Marquette Law School Poll
The survey was conducted Jan. 27-Feb. 5, 2025, interviewing 1,018 adults nationwide, with a margin of error of +/-3.5 percentage points.
Interviews were conducted using the SSRS Opinion Panel, a national probability sample with interviews conducted online. Certain other data from this survey (focusing on public opinion concerning the Supreme Court) are held for release on Feb. 13. The detailed methodology statement, survey instrument, topline results, and crosstabs for this release are available on the Marquette Law Poll website.
Question wording on Trump policies and executive orders:
- Recognize only male and female sexes: “Do you favor or oppose President Trump’s executive order requiring federal agencies to recognize biological sex as male or female only, eliminate references to gender identity in policies, and require federal documents, such as passports, to reflect biological sex, not gender identity?”
- Deport immigrants in U.S. illegally: “Do you favor or oppose deporting immigrants who are living in the United States illegally back to their home countries?”
- Expand oil and gas production: “Do you favor or oppose President Trump’s executive orders that aim to expand oil and gas production?”
- Declare emergency on southern border: “Do you favor or oppose President Trump’s executive order declaring migrant crossings along the U.S.-Mexico border to be a national emergency?”
- Deport immigrants in U.S. illegally, including without criminal record: “Do you favor or oppose deporting immigrants who are living in the United States illegally back to their home countries even if they have lived here for a number of years, have jobs, and no criminal record?”
- Take back the Panama Canal: “In his inaugural address, President Trump said the U.S. will take back the Panama Canal from Panama. Do you think the U.S. should take back the Canal, or should Panama continue to control it in accordance with the 1978 Panama Canal Treaties?”
- Pardon January 6 defendants: “Do you favor or oppose President Trump’s pardon of about 1,500 people convicted in the January 6, 2021 violence at the U.S. Capitol?”
- Rename Gulf of Mexico: “Do you favor or oppose President Trump’s executive order instructing the Secretary of the Interior to rename the Gulf of Mexico as the Gulf of America?”
About Kevin Conway

Kevin is the associate director for university communication in the Office of Marketing and Communication. Contact Kevin at (414) 288-4745 or kevin.m.conway@marquette.edu.